Euro-SiBRAM’2002 Prague, June 24 to 26, 2002, Czech Republic
Session 9
Timber Beam Reliability Assessment
Ing. Antonín Lokaj, Ph.D.
VŠB-TU Ostrava, 708 33 Ostrava-Poruba, Czech Republic,
Abstract
Attention is given to the verification of safety (referring to carrying kapacity) using SBRA method. This alternative approach is based on loads expressed by load duration curves, load effects combination analysis, on Madison curves, accumulation of damage procedure and the simulation technique.
Key Words: Timber Structures, Accumulation of Damages, Reliability Assessment.
Current European standards are based on the semi-probabilistic approach to structural reliability assessment representing by Partial Safety Factors (PSF). The developments in computer technology allows for considering a transition to application of higher level of assessment (fully probabilistic methods). One of these methods is SBRA (Simulation-based Reliability Assessment method).
The deterministic approach to structural reliability assessment has been replaced by semi-probabilistic method using Partial Safety Factors (PSF) which represents individual variables affecting the reliability. The PSF method is used in current European specifications (PSF method is also called Limit State Method). Limit states are states beyond which the structure no longer satisfies the relevant design criteria. Each random variable is represented by a characteristic value, which is modified by partial factors. This approach doesn’t allow direct evaluation probability of failure.
The transition to application of fully probabilistic concepts would require reengineering of the entire design procedure, re-arrangement of standards, development of databases and more. SBRA method (Simulation-based Reliability Assessment method) is documented in textbooks (Marek et al. (1995, 1998, 2001)) containing numerous examples of application related to the assessment of carrying capacity and serviceability. In SBRA method all input values are expressed by variables represented by bounded histograms, the loading is expressed by load duration curves, the reliability function RF = (R – S) is analysed using direct Monte Carlo method and the reliability is expressed by comparing the calculated probability of failure Pf and the target probability Pd given in standards (see, for example, CSN 73 1401-1998).
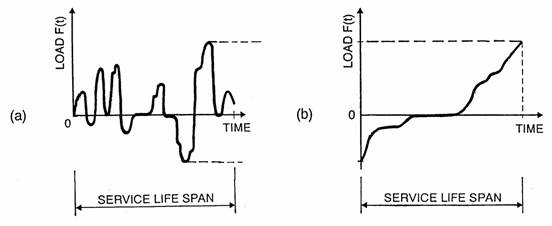
Each action is expressed by a load duration curve and a bounded histogram with the design load values in SBRA method. Corresponding bounded histograms are developed on the basis of correlation between action F(t) and time of the service life span (see Fig. 1a). This “Load time history curve” is rearranged to the “Load duration curve” (see Fig. 1b). Than the “Load duration curve” is transformed into relevant bounded histogram (see Fig. 2).
Fig. 1a Load time history curve Fig. 1b Load duration curve
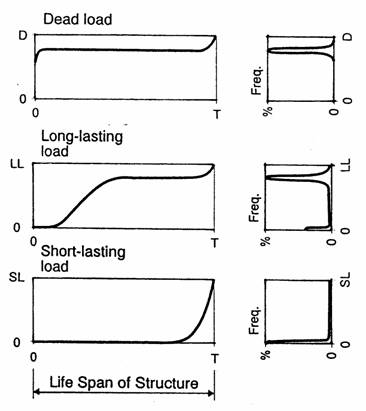
Fig. 2 Examples of Load duration curves and corresponding histograms
Structural timber is a building material of natural origin. It can be characterized by many positive features: high strenght in relation to its weight, easy processing with machines and tools, nice appearance of timber structures. On the other hand, timber is not a perfect structural material due to its natural origin. It is characterized by negative properties such as: capacity to absorb liquids and vapours from the environment, anisotropy of mechanical properties, anisotropy of swelling/drying processes, inhomogenity of physical and mechanical properties due to occurrence of many natural defects, dependence of physical and mechanical properties on time and environment. Increasing of moisture and durability of load combination effect in time leads to the reduction of strength of timber. This dependence is nonlinear. This effect on strength of timber was published (f.e.) in Wood (1951).
Material properties are expressed by bounded histograms obtained from laboratory tests of timber. For example MOR (Modulus of Rupture) and MOE (Modulus of Elasticity) of Czech softwood – see Fig. 3.
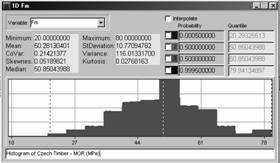
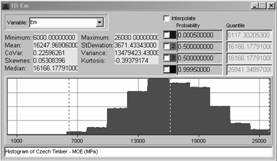
Fig. 3 Histograms of MOR (left) and MOE (right) of Czech softwood (MPa) according: Kuklík P. and Kuklíková A. (2000)
Duration of load combination effect and moisture content can be expressed by “Madison” – curve (= M-curve) – see Fig. 4 and Eq. (1) and (2).
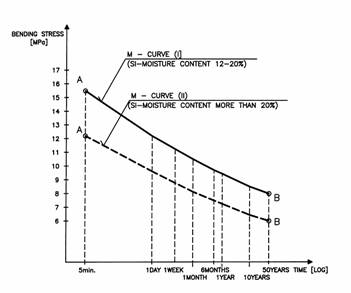
Fig. 4 Example of M-curve for structural timber (strength class SI) and various moisture contents
ft = f0 ´ a ´ t b (1)
ft = f0 ´ 0,9313 ´ t –0,0361 (2)
for: t = 1 (Hour)
where ft is the time dependent strength of timber, f0 is the bending strength obtained in standard laboratory test, a and b are coefficients, t is the time in suitable units (1 Hour).
The timber elements verification in ultimate limit states (Safety Assessment) in SBRA method is based on load effect combination analysis, the Madison curves, the accumulation of damage procedure, and the simulation technique.
Fig. 5 express the main ideas of this approach. The accumulation of damage assessment procedure is based on the summation of “partial damage” corresponding to individual discrete stress levels. A procedure of load effect combination analysis (using simulation technique) leads to the resulting load effect combination histogram Q. Histograms fk and fd representes piecewise uniform distribution of characteristic, resp. design values of timber strength. Madison curve (“M-curve”) defines the time to failure Ni for each stress level i. The M-curve is defined by points A and B and the shape – see eq. (1) and (2).
Time to failure for i-simulation step (Ni):
 (3)
(3)
si ... level of the stress in i - simulation step
fti ... strength of timber in i - simulation step
a, b ... constants (see Eq. (1) and (2))
There is determine „Partial damage“ of timber element in each i - simulation step:
Acci = t / Ni (4)
Where: t = basic unit of the time.
Value:
Acci = 438 500 * t / Ni (5)
representes „Partial damage“ of timber element in i-simulation step for 50 years of duration of this stress level.
Mean value of all these Acci representes summation of partial damages (å ti/Ni) for 50 years. Using Palmgrin-Miner rule:
å ti/Ni £ 1 (6)
When the result of condition (6) (e.g. summation of partial damages) is £ 1 Þ timber component seems to be safe.
Number of simulation steps dependes on degree of accuracy, which is required. For common situation seems to be enough 5-10 mil. simulation steps.
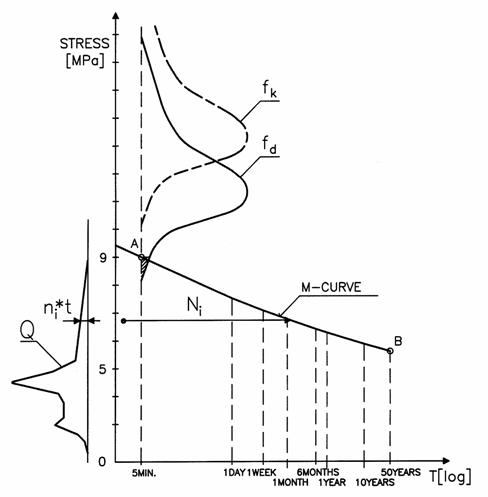
Fig. 5 The accumulation of damage - scheme
Assessment of timber column compression carying capacity. The timber column with pinned ends (see Fig. 6) is exposed to a vertical axial force P resulting from combination of dead, long lasting and short lasting loads. The initial curvature of the column is considered.
Length of the column: L = 4 m.
Rectangular cross-section: b/h = 160/160 mm
Initial curvature of the column: e0 = L/200.
The extreme load values:
Pdl = 110 kN (Dead load)
Pll = 110 kN (Long lasting load)
Psl = 110 kN (Short lasting load)
P = Pdl ´ Pdl,var + Pll ´ Pll,var + Psl ´ Psl,var (7)
Histograms: Pdl,var , Pll,var , Psl,var ... see Fig. 2.
Material: Czech softwood – according: Kuklík and Kuklíková (2001), histograms – see Fig. 3.
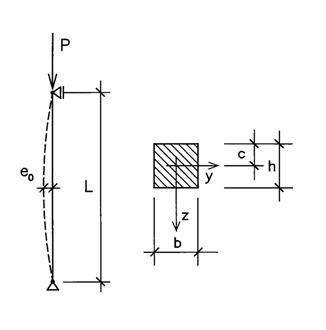
Fig. 6 The axial loaded column
Relation between compression and bending stregth (according EN 384):
Fc,0,k = 5 fm,k 0.45 (8)
Safety assessment was made for 10 mil. simulation steps.
Compression stress of column with initial curvature (2nd order computing) according Gere and Timoschenko (1990):
 (9)
(9)
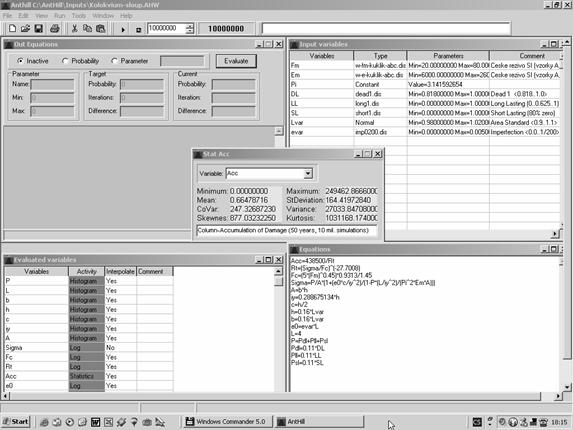
Fig. 7 The accumulation of damage – output of AntHillä computer program
The accumulation of partial damages after 50 years (and 10 mil. simulation steps): Acc = 0,665 < 1 Þ timber column is safety designed.
SBRA method introduces qualitatively new approach in the structural design corresponding to the computer era. It allows the designer for better understanding the actual safety and serviceability of timber components. The application of Monte Carlo simulations technique corresponds to the potential of computers available to all designers.
Acknowledgments. This work has been supported by the Grant Agency of Czech Republic grant No. 103/01/1410 "Application of the new generation of probabilistic methods in the assessment of structural safety, serviceability and durability".
Special thanks to Assoc. Prof. P. Kuklík, Ph.D. for statistical data of czech softwood strength.
[1] Marek, P., Guštar, M. and Anagnos, T. (1995) Simulation-based Reliability Assessment for Structural Engineers, CRC Press, Inc., Boca Raton, Florida.
[2] Marek, P., Guštar and Bathon, L. (1998) Tragwerksbemessung. Von deterministischen zu probabilistischen Verfahren, ACADEMIA Praha.
[3] Marek P., Brozzetti J. and Guštar M., (editors), (2001) Probabilistic Assessment of Structures using Monte Carlo Simulation – Backround, Excercises and Software, ITAM CAS Praha.
[4] Marek, P., Guštar, M., (1988-2001), Computer programs DamAc™, M-Star™ , AntHill™ (Copyright), Distr. ARTech, Nad Vinicí 7, 143 00 Praha 4.
[5] Wood L.W. (1951) Relation of stregth of wood to duration of load, U.S. Forest Products Laboratory Report No. 1916.
[6] Gere J. M., and Timoshenko S. P., (1990), „Mechanics of materials“, 3rd Ed., PWS-KENT Publishing Company, Boston.
[7] Kuklík P., Kuklíková A., (2000) Metody zjišťování vlastností dřeva na stavební konstrukce, Stavební obzor 8/2000, str. 242-245, Praha.
[8] Kuklík P., Dolejš J. (1998) Nondestructive Evaluation of Structural Timber. Proc. 5th World Conference on Timber Engineering, Montreux, pp. 692-699.
[9] Kuklík P., Kuklíková A. (2000) Nondestructive Testing of Solid Timber. Proc. International Conference on Wood Fiber Composites, Stuttgart, pp. 303-312.