Euro-SiBRAM’2002 Prague, June 24 to 26, 2002, Czech Republic
Session 9
Optimization Study of Beam with Sudden Profile Change
This paper deals with the application of the SBRA (Simulation Based Reliability Assessment method [1]) for safety assessment of a welded steel beam with a sudden profile variation. Close attention is paid especially to the determination of the position where the profile changes.
Assignment
The beam is simply supported. The span is L = 4 m, the material grade is steel S235. The beam is exposed to two uniformly distributed loads. The design values are: dead load g = 10 kN/m, long lasting live load q = 8 kN/m. Assess I-profiles of this steel welded beam (see Fig. 2) regarding the bending moment. Determine the position where the profile is to be changed with respect to material savings. Lateral-torsion buckling of the beam is prevented. Do not assess the serviceability limit state. The design probability of failure is Pf,lim £ 0.00007.
Fig. 1 Beam scheme Fig. 2 Profile 1, Profile 2
Structure Response to the Load 'S'
The variable value of the load is equal to the product of its maximum
value and the coefficient expressing its variation by the assumptive
distribution, then g = 10 kN/m ∙ gvar,
q = 8
kN/m ∙ qvar. Individual distributions follow in the
chart (Fig. 3).
|
dead load gvar distribution |
dead1.dis |
|
|
long lasting load qvar distribution |
long1.dis |
|
Fig. 3 Variables of the response
The bending moment behavior along the beam Mx = ½ ∙ (g + q) ∙ (L ∙ x - x2) is traced by the AntHill [1] software. The variables taking part in this simulation are g, q.

Fig. 4 Structure response, dispersion of the bending moment Mx along the beam
Structure Resistance 'R'
The variable value of the steel yield stress is equal to the coefficient expressing its variation by the assumptive distribution, then f = fvar. The variable values of the profile moduluses are equal to the products of their nominal values and the coefficients expressing their variation by the assumptive distributions, then W1 = W1,nom ∙ Wvar, W2 = W2,nom ∙ Wvar. Individual distributions follow in the chart (Fig. 5).
|
steel yield stress fvar distribution |
st235.dis |
|
|
profile moduluses Wvar distribution |
n1-05.dis |
|
Fig.5 Variables of the resistance
The nominal values of the cross-sections properties are W1,nom = 1.64E-4 m3, W2,nom = 1.25E-4 m3. The profiles 1 and 2 are displayed on Fig. 2.
The structure resistance is defined as the product Mr = W ∙ f, than Mr1 = W1 ∙ f, Mr2 = W2 ∙ f.
Assessment
Critical cross-sections, considering the bending moment, are for Profile 1 the center of the beam (x = 2 m), for Profile 2 the place of its sudden profile variation (x = ?).
Profile 1, x = 2 m
In the center of the beam's span is the failure probability Pf = 0.000053 < Pf,lim = 0.00007. Profile 1 satisfies the requirements, calculated by the AntHill [1] software.
Fig.6 SFF1, cross-section of Fig.7 in the span center (x =2 m), Pf is determined by the intersection of the resistance and response graphs
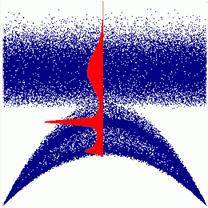
Fig. 7 AntHill: response Mx and resistance MR1

Fig. 8 SF1 = R – S
Profile 2, x = ? m
With assistance of the AntHill [2] software, the probability of failures is found in individual positions near the estimated location of the sudden profile change.
|
MR2 |
profile: |
I-140/90-10mm |
|
|
|
|
x[m] |
prob. Pf[0] |
|
|
|
|
0,90 |
0,0000000 |
|
|
|
|
0,95 |
0,0000000 |
|
|
|
® |
1,00 |
0,0000270 |
¬ |
|
|
|
1,05 |
0,0001297 |
|
|
|
|
1,10 |
0,0004193 |
|
|
|
|
1,20 |
0,0018979 |
|
|
|
|
1,40 |
0,0104442 |
|
|
|
|
1,60 |
0,0280406 |
|
Fig. 9 Optimization, probability of failure calculating Pf near the sudden change location
The profile should be changed in position x = 1 m from the support. The failure probability in this location Pf = 0.000027 (see Fig.9) < Pf,lim = 0.00007. Profile 2 satisfies the requirements. Calculated by the AntHill [2] software.
Fig. 10 SFF2, cross-section of Fig.11 in the x =1 m position, Pf has been determined by the intersection of the graphs of resistance and response
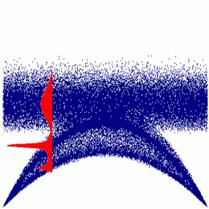
Fig. 11 AntHill: response Mx and resistance MR2
Fig. 12 SF2 = R – S
Global Analysis of Profile 1 and 2
MS(x) MR2
![]()
Fig. 13 Response and resistance, bending moments Mx, MR1, MR2
Additional Study
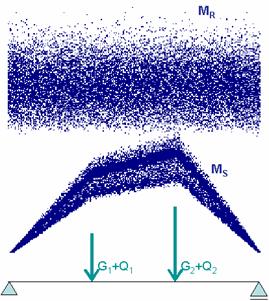
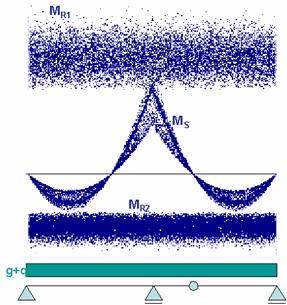
Fig. 14 AntHill: response Ms and resistance MR
Conclusions
This study outlines the opportunity of using the SBRA method [1] for the global reliability assessment. The used example is very simple; however, it is possible to asses more complicated statically determined structures.
Literature
[1] Marek P., Gustar M., and Anagnos T. (1995). Simulation based reliability assessment for structural engineers. CRC Press, Inc, Boca Raton, Florida.
[2] Probabilistic Assessment of Structures using Monte Carlo Simulation; editors: P. Marek. J. Brozzetti, M. Gustar; publisher: ITAM CAS CR, Prague 2001.