Euro-SiBRAM’2002 Prague, June 24 to 26, 2002, Czech Republic
Session 8
Reliability assessment of composite steel concrete cross section of roadway bridge
Abstract
Reliability verification of composite steel concrete cross section of roadway bridge exploiting fully probabilistic SBRA method (Simulation Based Reliability Assessment) based on the application of Monte Carlo simulation technique [1]. There is made a comparison between SBRA and conventional design method.
In accordance with today’s national bridge standardes and corresponding Eurocodes the design bending resistance may by determined by plastic theory where the effective composite section is in Class 1 or Class 2. It allows for the benefit from existing plastic reserves. Then the cross section should be verified separately at the ultimate limit states – safety assessment (effects of temperature, reological concrete changes and assembling may be neglected) and at the serviseability limit states – limitation of stresses (effects of temperature, reological changes and assembling should be taken into account, elastic behaviour of steel section must not be exceeded). The analysis based on fully probabilistic concept is performed using computer programs M-StarTM [2] and Anthill™ [3] and realized for both elastic and plastic theory of behaviour. Output of these programs is the probability of failure Pf, safety function is expressed by histogram. Obtained probabilities of failure Pf are then compared with target probability of failure Pd according to ČSN 73 1401 [4].
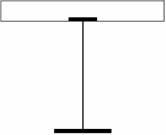
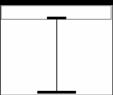
On the optimized real bridge composite cross-section, see Fig. 1 and 2, representing roadway composite beam of the span 34,7 m with structural height (1/22)L (steel material S355, concrete C25/30), comparison is made between mentioned conventional method and fully probabilistic SBRA method (Simulation Based Reliability Assessment). The marginal fibres of steel section will be observed. Stability problems during assemling are not considered, effects of shear forces are neglected.
Fig. 1: Exploitation of cross section
Fig. 2: Verified composite cross section
Common level of target probability is considered according to ČSN 73 1401-1998 [4]:
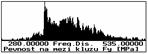
Pd = 0,000070 for ULS, Pd = 0,070000 for SLS, input variables are expressed by bounded histograms, see Tab.1 and Fig. 3.
Tab. 1: Definition of input variables


a) P355fy01.his
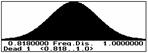
b) DEAD1.his
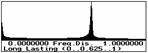
c) LONG1.his
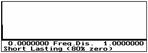
d) SHORT1.his
e) N1-01.his
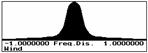
f) WIND1.his
Fig. 3: Input histograms
Reliability function:
FS = (R - S) (1)
Reliability verification will be performed for elastic behaviour of the cross section and considered reference value – achievement of the yield point in the marginal fibres of steel section.
Resistance of the structure R is expressed by bounded histogram of yield stress, Fig. 3:
R = O,9 . Fy . Fyvar, for Fy = 1 (2)
Load effect definition for upper fibres of steel section (stress expression):
S = SIGho = (Moc + Mm)/Whom + Mdl/Whodl + Mkr/Whokr +
(Ps/Fis + Ms/Whos) + (Pt/Fit + (Pt . rb)/Whot) (3)
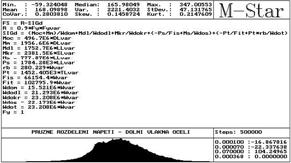
in case of lower fibres of steel section:
S = SIGdo = (Moc + Mm)/Wdom + Mdl/Wdodl + Mkr/Wdokr +
(– Ps/Fis + Ms/Wdos) + (– Pt/Fit + (Pt . rb)/Wdot) (4)
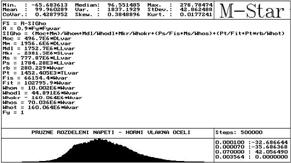
For most exploited upper fibres of steel section:
probability of failure Pf = 0,003564 > target probability of design Pd = 0,00007.


(Moc + Mm) Mdl Mkr (Ps + Ms) (Pt + Mt) sum
Fig. 5: Load effect in stress expression
3.2.1 ULS – plastic behaviour of the cross section
Position of plastic neutral axis was determined with probability (1 – Pd), measured from the point of upper fibres of composite section, see Fig. 6.
Resistance of the structure R is
defined as a plastic bending resistance, where yield point of steel
material and cylinder strength of
concrete are expressed by bounded histograms, see
Fig. 7:
Fyd = O,9 . Fy . Fyvar, for Fy = 1 (5)
Fcd = 0,85 . Fck . Fcvar, for Fck=1 (6)
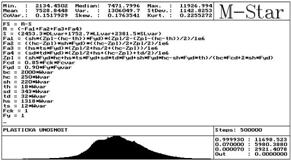
Fig.6: Plastic neutral axis
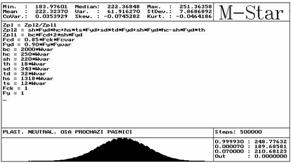
Fig.7: Probability of failure according to plastic theory
Probability of failure Pf << target probability of design Pd = 0,00007.
3.2.2 SLS – verification of elastic behaviour of the cross section
From a point of view of stress limitation for SLS (elastic behaviour) the cross section is satisfactory, probability of failure Pf = 0,003564 < target probability of design Pd = 0,07, see Fig. 4.
4 Conclusions
The article demonstrates analysis of composite steel concrete bridge cross section with use of fully probabilistic SBRA method based on the application of Monte Carlo simulation technique. Service life was considered according to ČSN 73 1401 Td = 80 years.
Use of bounded histograms, which represent duration of individual load category, enables better multicomponent load simulation, the alternate character of temperature changes can be modeled in a real way.
Tab. 2: Final reliability
|
fibre |
elastic behaviour for ULS |
plastic behaviour for ULS |
|
upper fibres of steel |
Pf = 0,003564 > Pd = 0,000070 (dangerous) |
Pf < 0,000001 (excessive safety), simultaneously elastic behaviour of cross section is conserved for SLS Pf,el. = 0,003564 < Pd = 0,07 |
|
lower fibres of steel |
Pf = 0,000368 > Pd = 0,000070 (dangerous) |
Literature
[1] Marek, P., Guštar, M., Anagnos, T., Simulation-Based Reliability Assessment for Structural Engineers, CRC Press, Inc., Boca Raton, Florida, 1995.
[2] Marek, P., Guštar, M., Computer program M-StarTM (Copyright), Distr. ARTech, Nad Vinicí 7, 143 00 Praha 4, 1989-96.
[3] Marek, P., Guštar, M., Computer program AntHillTM (Copyright), Distr. ARTech, Nad Vinicí 7, 143 00 Praha 4, 1989-96.
[4] ČSN 73 1401, Design of steel structures (in Czech), Prague, Czech institute of normalization, 1998.