Euro-SiBRAM’2002 Prague, June 24 to 26, 2002, Czech Republic
Professor Ing. Ján Hudák, PhD.
Technical University Košice, Slovak Republic
Initiation and propagation of cracks caused by variable repeated load-effects characterize the fatigue process. The fatigue process leads to progressive failure and total diminution of the service life of the loaded components of structures. Decisive factors, which determine this process are loading history and corresponding load effects history, geometrical form of structure, configuration of details, residual stresses due to rolling and/or welding etc., and eventually defects and stress concentrations. The primary influence on the fatigue damage and failure, considering the mentioned effects and factors have, first of all, the load effects history, stress concentrations and residual stresses.
In the aspect of the solution of problem fatigue loading
and stress using probabilistic approach is necessary to give
attention to the analysis of loading and of the response of the
structure to the loading. The result of this analysis is
determination of the response spectrum, which was created by
statistically modeling the pay-load Q together with the position
of the crab
![]() within
the span of the crane
within
the span of the crane
![]() ,
with limiting lengths in the ended parts
,
with limiting lengths in the ended parts
![]() .
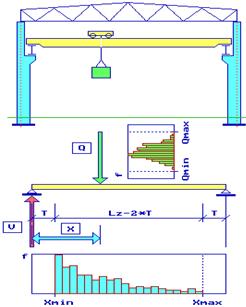
For dispersion variance of intensity of loading in the investigated
range and density character of probabilistic incidence is represented
by histograms (see Figure 1). We can proceed by the same method in
order to determine the crab position histogram on the crane
bridge
.
For dispersion variance of intensity of loading in the investigated
range and density character of probabilistic incidence is represented
by histograms (see Figure 1). We can proceed by the same method in
order to determine the crab position histogram on the crane
bridge![]() .
From this two quantities, which characterize magnitude of load and
its position by using of transformation model of simple beam are
determined its support reactions
.
From this two quantities, which characterize magnitude of load and
its position by using of transformation model of simple beam are
determined its support reactions
![]() for
random chosen quantities from loading spectrum
for
random chosen quantities from loading spectrum
![]() and
crab position
and
crab position
![]() .
By these supporting reactions are determined components of wheel
loading spectrum of crane
.
By these supporting reactions are determined components of wheel
loading spectrum of crane![]() ,
which by this way concisely can characterize the response of the
structure to the crane-load history.
,
which by this way concisely can characterize the response of the
structure to the crane-load history.
The value, which enters the reliability condition, is loading
effect as the result of interaction of loading and transformation
model of structure. Transformation model of structure is suitable to
elect in the form of influence line of static quantity, which is
investigated. The time diagram of loading effect for determined
period of working shift, eventually for time of one year, we obtain
by moving on the influence line of system of loading, which is
introduced by chosen wheel loading
![]() from
the loading spectrum.
from
the loading spectrum.
2. Modeling of loading
For
demonstration of introduced problem we will contemplate the crane way
girder in industrial hall of 30 m span and span of columns 6 m. In
the hall are working two cranes with carrying capacity 50
![]() and
32
and
32
![]() ,
width supposing 100 crossing per working shift. The aim of task is to
determine probability failure of steel girder
,
width supposing 100 crossing per working shift. The aim of task is to
determine probability failure of steel girder
![]() from
the point of view of fatigue loading caused by normal stress in the
lower part of girder in the middle of its spoon.
from
the point of view of fatigue loading caused by normal stress in the
lower part of girder in the middle of its spoon.
Geometrical dimensions of welded steel girder with high
1050
![]() made
from steel S235 were determined by preliminary analysis.
made
from steel S235 were determined by preliminary analysis.
At preparation of introduced characteristics of tracing
values of loading we use known nominal value of carrying capacity of
loading
![]() .
Dispersion variance of this value by using statistical analysis is
possible to consider according to loading coefficients
.
Dispersion variance of this value by using statistical analysis is
possible to consider according to loading coefficients
![]() in
range
in
range
![]() and
also
and
also
![]() .
Ended values of crab-crane position are determined by value
.
Ended values of crab-crane position are determined by value
![]() distance
especially by value
distance
especially by value
![]() and
and
![]() ,
where
,
where
![]() is
spoon of crane bridge. There are vectors
is
spoon of crane bridge. There are vectors
![]() and
and
![]() which
are generated by application of histograms, which are similar to
statistically distribution for range of minimally and maximally
values. After this preparation is possible to find necessary elements
of introduced vectors.
which
are generated by application of histograms, which are similar to
statistically distribution for range of minimally and maximally
values. After this preparation is possible to find necessary elements
of introduced vectors.
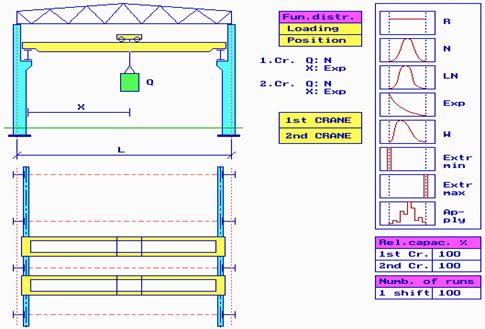
Fig.
1 Selection of histograms similar to statistically
distribution for loading
![]() and
crab-position
and
crab-position
![]()
For optional number from file![]() will
will
![]() -
element of loading vector
-
element of loading vector
![]() and
similarly for
and
similarly for
![]() will
will
![]() -element
of loading positions vector
-element
of loading positions vector
![]() .
There
.
There
![]() -
element wheel loading vector
-
element wheel loading vector
![]() can
be expressed from formula for the reaction of simple beam
can
be expressed from formula for the reaction of simple beam
![]() ,
,
![]() =
1, 2, …
=
1, 2, …
![]() (1)
(1)
Where
![]() is
weight of crane crab,
is
weight of crane crab,
![]() -
weight of crane bridge.
-
weight of crane bridge.
The wheel-loading vector will be step by step calculated
for
![]() ,
and its form is possible to express as
,
and its form is possible to express as
![]() .
.
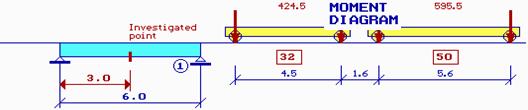
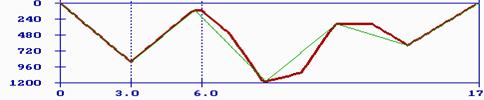
2. Modeling of loading effects
The time course of loading effects in the tracing point of crane girder structure is possible to determine by statically transformation model using influence line. The file of quantities for course bending moment diagram can be expressed by discrete values
![]() ,
,
![]() =
1, 2, …
=
1, 2, …
![]() (2)
(2)
Where
![]() is
actual value of loading from wheel of crane,
is
actual value of loading from wheel of crane,
|
|
|
||
![]() -
Ordinate of influence line of bending moment on the crane way girder.
-
Ordinate of influence line of bending moment on the crane way girder.

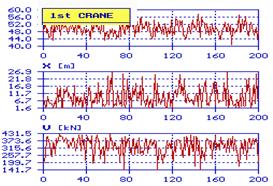
Fig. 2 Vectors of values of loading
![]() ,
crab position
,
crab position
![]() and
wheel loading
and
wheel loading
![]()
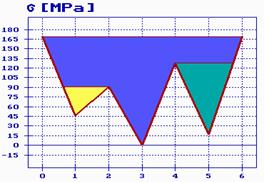
As is next expressed for given geometry of girder and random choose value of wheel loading from created loading spectrum the time diagram of bending moments is determine in elected point of crane way girder. In next step are identified local extremes of bending moments and for these bending moments and designed cross section of crane way girder adequate values of normal stress are calculated.
File of values of determined stress is characterize time course of loading effects for one crossing of two cranes.
|
|
|
|
|
|
|
||
Fig. 3 Bending moments course on the crane way girder at one crossing of cranes with nominally values of loading
|
|
|
|
|||
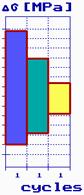
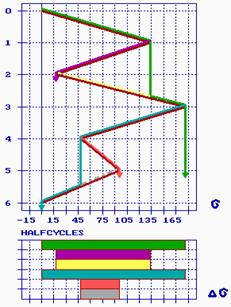
a) Reservoir method b) Rain Flow method
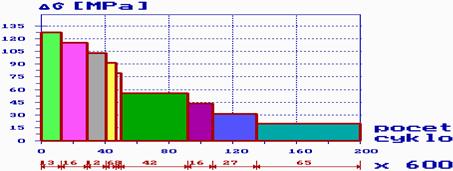
Fig. 4 Stress range spectrum for one crane crossing
|
|
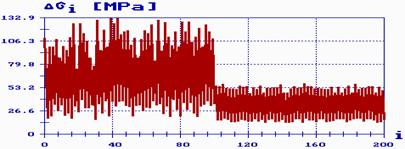
Fig. 5 Stress range spectrum for one working shift
|
|
|
|
Fig. 6 Stress range spectrum for one working year
Discrete values of normal stress are determined from discrete values of bending moments in single peaks of moment’s line
![]() ,
,
![]() =
1, 2, …
=
1, 2, …
![]() (3)
(3)
Where
![]() is
extreme magnitude in
is
extreme magnitude in
![]() -
peak of bending moment line,
-
peak of bending moment line,
![]() -
Inertia moment of cross section of crane way girder to central axis
-
Inertia moment of cross section of crane way girder to central axis
![]() ,
,
![]() -
Coordinate of investigated point on the girder from center of
gravity,
-
Coordinate of investigated point on the girder from center of
gravity,
![]() -
Number of extremes in tracing diagram of bending moments.
-
Number of extremes in tracing diagram of bending moments.
The introduced process is repeated for given number of crane crossings per working shift. This time course of loading effects in elected point of girder has stochastic characters and it is necessary made of retransform on the equivalents stress range spectrum. The necessary transformation is made using classifying method Reservoir.
3. Fatigue damage
The fatigue strength at variable repeating loading changes in dependence on number cycles and on configuration of detail. This strength is determined from experimental results in form S-N curve. Code STN 731401 “Design of steel structures” applies three linear curves for normal stress range. The equation of fatigue strength curve is given in form
![]() (4)
(4)
Where
![]() is
fatigue strength,
is
fatigue strength,
![]() -
Number of cycles to failure,
-
Number of cycles to failure,
![]() -
Constant, which expresses inclination of fatigue strength curve,
-
Constant, which expresses inclination of fatigue strength curve,
![]() -
Constant by table 28 in STN 73 1401.
-
Constant by table 28 in STN 73 1401.
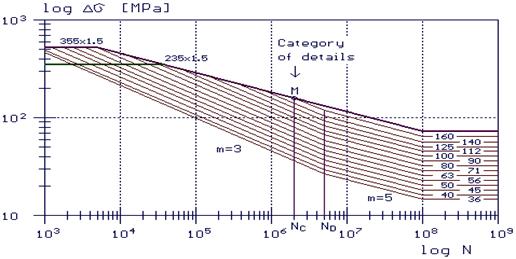
Fig. 7 S-N curves for normal stress range by STN 73 1401
4. Accumulation of fatigue damage
We will apply cumulative hypothesis of Palmgren-Miner. This
hypothesis is based on the assumption that
every individual change of stress
range
![]() ,
which
,
which
![]() multiple
repeating would cause break, will cause damage
multiple
repeating would cause break, will cause damage
![]() ([8]).
Total damage is expressed in form
([8]).
Total damage is expressed in form
![]() (5)
(5)
Where
![]() is
number of cycles in spectrum for stress range level
is
number of cycles in spectrum for stress range level
![]() ,
,
![]() -
Number of cycles to damage for stress range level
-
Number of cycles to damage for stress range level
![]() .
.
Table 1 – numerical data of value of spectra from by fig. 6
|
Stress level |
|
Spectrum of one year
|
S-N curve
|
S-N curve
|
|
1 |
18,6 |
39 000 |
- |
- |
|
2 |
31,5 |
16 200 |
- |
- |
|
3 |
43,5 |
9 600 |
69 751 526 |
108 530 977 |
|
4 |
55,4 |
25 200 |
20 819 006 |
36 682 590 |
|
5 |
67,3 |
0 |
- |
- |
|
6 |
79,2 |
1 800 |
4 025 542 |
6 142 909 |
|
7 |
91,2 |
3 600 |
2 636 425 |
3 706 939 |
|
8 |
103,1 |
7 200 |
1 824 836 |
2 565 807 |
|
9 |
115,0 |
8 600 |
1 314 941 |
1 848 870 |
|
10 |
127,0 |
7 800 |
976 312 |
1 372 741 |
If the histograms of number of cycles to damage, which are adequate to stress levels in response spectrum are known, the formulation damage cumulation we can express in the form of vector
![]() (6)
(6)
For elected category of detail 100 above given S-N curve
for normal stress in table 1 for stress levels from stress range
spectrum are determined limits of number of cycles
![]() and
and
![]() by
equation (4).
by
equation (4).
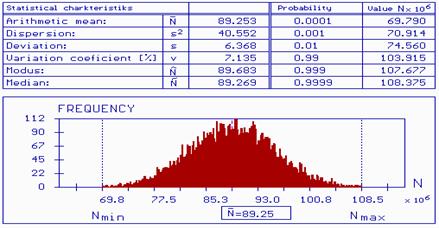
Fig.
8 Histogram
![]()
![]() and
statistical characteristics of number of cycle to damage for stress
range level
and
statistical characteristics of number of cycle to damage for stress
range level
![]()
![]()
Minimal value
![]() is
expressed from curve considered detail category 100 and maximal value
is
expressed from curve considered detail category 100 and maximal value
![]() is
expressed from neighbor upper curve of category detail 112.
Considering that stress levels of blocks 1 and 2 are under threshold
values, they are not considered in computation of damage cumulation.
For upper stress range levels will prepare histograms
is
expressed from neighbor upper curve of category detail 112.
Considering that stress levels of blocks 1 and 2 are under threshold
values, they are not considered in computation of damage cumulation.
For upper stress range levels will prepare histograms
![]() .
After preparing of necessary characteristics we can write vector of
damage cumulation
.
After preparing of necessary characteristics we can write vector of
damage cumulation
![]() (7)
(7)
Where
![]() is
number of years of crane way exploitation.
is
number of years of crane way exploitation.
5. Reliability assessment
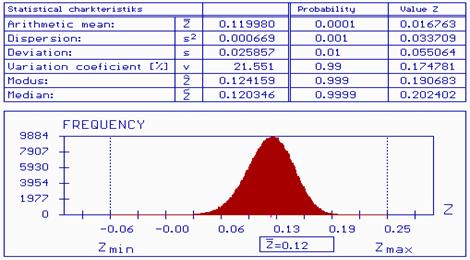
Fig.
9 Histogram and statistical characteristics of
reliability reserve
![]()
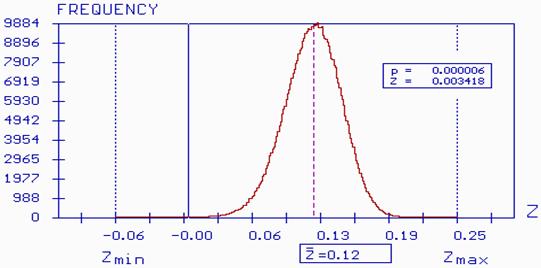
Fig.
10 Marking of probability failure in histogram of
reliability reserve
![]()
The reliability structure of crane way from the point of view of high cycle fatigue damage using probabilistic approach [1], [2], [3] [8] we can express function of reserve reliability
![]() (8)
(8)
Where
![]() is
limit value of damage accumulation, which is given of value 1.
is
limit value of damage accumulation, which is given of value 1.
Computation function of reliability reserve is made by M-Star program for 500000 simulation (see fig. 9).
Probability of failure
![]() is
calculated by using simulation method Monte Carlo for time of
exploitation
is
calculated by using simulation method Monte Carlo for time of
exploitation
![]() =
49,2 years
=
49,2 years
![]() =
0,000006 <
=
0,000006 <
![]() =
0,00007
(9)
=
0,00007
(9)
Where
![]() is
design value of probability failure by table A1 in STN 731401.
is
design value of probability failure by table A1 in STN 731401.
6. Conclusions
The application of reliability condition of high cycle fatigue belong to relative complicate tasks from the point of view on various random variable characteristics, which enter from side of loading effect expressed by stress range spectrum and also from the side of resistance of structure expressed by S-N curves. Probabilistic approach using Monte Carlo simulation was applied in the analysis of the load-effects spectrum and also the stress range spectrum using program called CRANE WAY, developed in cooperation with Prof. P. Marek within the framework of an earlier research project. Reliability analysis is based on the SBRA method [1] and M-Star program was used.
[1] MAREK, P. - GUŠTAR, M. and ANAGNOS, T.: Simulation-Based Reliability Assessment for Structural Engineers. CRC Press, New York, 1996.
[2] MAREK, P. - GUŠTAR, M. and BATHON, L.: Tragwerksbemessung von detrminstischen zu probabilistischen verfahren. ACADEMIA Praha, 1998.
[3] MAREK, P. - BROZZETI and GUŠTÁR, M.: Probabilistic Assessment of Structures using Monte Carlo simulation. Praha 2001.
[4] HUDÁK, J. - MAREK, P. - VIRČÍK, J.: Vybrané state z kovových konštrukcií a mostov. Únava a krehký lom oceľových dielcov. ES VŠT Košice, 1987.
[5] HUDÁK, J. - KUĽKOVÁ, E.: Meddling of real loading process and response determination by the simulation on a computer. In: Proceedings of the 2nd International Scientific Colloquium CAE TECHNIQUES. Bielefeld , 1995.
[6] HUDÁK, J.: Spektrá rozkmitov napätí nosníka žeriavovej dráhy pri posudzovaní na únavu. In.: Zborník „IV. Naukowa konferencja Rzeszowsko-Lwowska – Problemy budownictwa i inżinierii środowiska“, Rzeszów, 1995.
[7] HUDÁK, J.: K problematike posudzovania spoľahlivosti oceľových konštrukcií na únavu v STN 731401. Inžinierske stavby č. 7-8, Bratislava, 1997.
[8] VLK, M.: Využití simulační metody Monte Carlo při hodnocení životnosti v oblasti vysokocyklové únavy. In.: Conference ENGNEERING MECHANICS ´ 95, Svratka 1995.