
Euro-SiBRAM'2002 Prague, June 24 to 26, 2002,Czech Republic
Issues in SBRA: the Simulation of Correlated Random Variables Using the Karhunen-Loeve Transform (KLT)
Prof. George R. Fegan
Applied Mathematics Dept., Santa Clara University, Santa Clara, CA 95053, USA
gfegan@scu.edu, scufeg@aol.com
Abstract
The simulation of a discrete number of correlated random variables using the Karhunen-Loeve transform (KLT) is discussed. Two examples are given: the first, using Nomal random variables; the second, using continuous Uniform random variables. The example using Normal r.v.'s is well documented in the literature. The second example is less familiar and possesses some results, which are very interesting with regard to reliability assessment.
Key Words: Karhunen-Loeve Transform, covariance matrix, Schwarz inequality, boundary inequalities.
Given a general (n x n) covariance matrix:
a transformation matrix
![]() is
to be constructed such that the
is
to be constructed such that the
![]() uncorrelated
random variables
uncorrelated
random variables
![]() are
to be transformed into
are
to be transformed into
![]() random
variables which possess the properties of having zero means and the
given covariance matrix
random
variables which possess the properties of having zero means and the
given covariance matrix
![]() .
The only constraints on the
.
The only constraints on the
![]() are:
mutual independence, zero mean, and unit variance.
are:
mutual independence, zero mean, and unit variance.
With these constraints, it can be shown that
![]()
![]() and
any
and
any
![]() matrix
with this property is such a transformation matrix. The symmetry of
matrix
with this property is such a transformation matrix. The symmetry of
![]() implies
implies
![]() can
be decomposed into the product of matrices of eigenvectors and
eigenvalues, namely the orthogonal decomposition
can
be decomposed into the product of matrices of eigenvectors and
eigenvalues, namely the orthogonal decomposition
![]() .
The matrix A can then be chosen as:
.
The matrix A can then be chosen as:
![]() .
.
Letting
![]() be
the (n x 1) matrix consisting of the
be
the (n x 1) matrix consisting of the
![]() and
and
![]() be
the (n x 1) matrix consisting of the
be
the (n x 1) matrix consisting of the
![]() ,
then
,
then
![]() and
and
![]() ,
where the components of
,
where the components of
![]() are
are
![]() ,
uncorrelated random variables with variance,
,
uncorrelated random variables with variance,
![]() .
These are the fundamental relationships of elementary K-L theory, for
a finite number of random variables (a discrete process), which gives
a procedure for generating correlated random variables.
.
These are the fundamental relationships of elementary K-L theory, for
a finite number of random variables (a discrete process), which gives
a procedure for generating correlated random variables.
The objective of Example 1 is to generate correlated
normal random variables and then compare the sample correlation
matrix with the theoretical
![]() .
An arbitrary covariance matrix was chosen:
.
An arbitrary covariance matrix was chosen:
 .
.
Eigenvalues and eigenvectors were calculated and the
matrix
![]() was
calculated:
was
calculated:

6000 input vectors were generated using (3 x 1)
independent normal variates
![]() ,
using the Box-Muller procedure. These input vectors were then
transformed by the matrix
,
using the Box-Muller procedure. These input vectors were then
transformed by the matrix
![]() .
The sample covariance matrix was calculated and denoted by
.
The sample covariance matrix was calculated and denoted by
![]() .
The original covariance matrix
.
The original covariance matrix
![]() and
the sample covariance for the 6000 variates are compared below.
and
the sample covariance for the 6000 variates are compared below.


Texts
on probability deal extensively with the joint distribution of 2
normal random variables. They usually show the circular contour plots
for the case in which the variates are independent and then move on
to show the elliptical shape of the contours as
![]() increases.
The contours culminate in a straight line when
increases.
The contours culminate in a straight line when
![]() .
It is obvious that the density function of the correlated the joint
distribution is larger than that of the density function of the
uncorrelated density function in certain regions of the domain. This
is an important factor in risk assessment. It is also worth noting
that the marginal distributions of each random variable
.
It is obvious that the density function of the correlated the joint
distribution is larger than that of the density function of the
uncorrelated density function in certain regions of the domain. This
is an important factor in risk assessment. It is also worth noting
that the marginal distributions of each random variable
![]() generated
by the K-L transform remains a Normal r.v. with
generated
by the K-L transform remains a Normal r.v. with![]() .
This retention of normality makes calculations of risk quite
straightforward as one proceeds from the joint distribution to the
marginal distributions. The marginal densities remain normal and the
parameters are immediate.
.
This retention of normality makes calculations of risk quite
straightforward as one proceeds from the joint distribution to the
marginal distributions. The marginal densities remain normal and the
parameters are immediate.
The objective of Example 2 is not just to generate
correlated normal random variables and to compare the sample
correlation matrix with the form of the theoretical
![]() .
The objective is to explore this, supposedly, uncomplicated
correlated joint distribution and to discover where and how the risks
in the correlated distribution affect risk assessment.
.
The objective is to explore this, supposedly, uncomplicated
correlated joint distribution and to discover where and how the risks
in the correlated distribution affect risk assessment.
The starting point in the development of a generation
procedure for a correlated joint uniform distribution is the
generation of uniform random numbers
![]() on
the interval [0,1]. These random numbers do not meet the criteria of
K-L tranform:
on
the interval [0,1]. These random numbers do not meet the criteria of
K-L tranform:
![]() since
their mean is
since
their mean is
![]() and
their variance is
and
their variance is
![]() However,
an initial transformation:
However,
an initial transformation:
![]() does
produce input variables consistant with the KLT criteria. The joint
density of the
does
produce input variables consistant with the KLT criteria. The joint
density of the
![]() is
that of a uniform density, namely
is
that of a uniform density, namely
![]()
![]() with
boundary equations
with
boundary equations
![]() ,
where
,
where
![]() and
and
![]() label
the horizontal and vertical axes respectively.
label
the horizontal and vertical axes respectively.
If one considers the general covariance matrix:
![]() ,
,
then the eigenvalues are
 .
This result shows that
.
This result shows that
![]() is
increasing and
is
increasing and
![]() is
decreasing as the absolute value of the covariance increases. The
Schwarz inequality implies a bound of
is
decreasing as the absolute value of the covariance increases. The
Schwarz inequality implies a bound of
![]() on
the maximum absolute value of the covariance. For zero covariance,
the eigenvalues are just the variances of the joint r.v.'s. Since for
the linear transformation
on
the maximum absolute value of the covariance. For zero covariance,
the eigenvalues are just the variances of the joint r.v.'s. Since for
the linear transformation
![]() the
matrix
the
matrix![]() is constructed using the square roots of the eigenvectors and since
is constructed using the square roots of the eigenvectors and since
![]() is
an orthogonal matrix, the Jacobian of the transformation is
is
an orthogonal matrix, the Jacobian of the transformation is
![]() .
The Jacobian of the inverse transformation is
.
The Jacobian of the inverse transformation is
![]() .
This implies that joint density of the
.
This implies that joint density of the
![]() is
is
![]()
![]() ,a
uniform distribution, but the boundary equations are no longer
parallel to the horizontal and vertical axes when cov(1,2)
,a
uniform distribution, but the boundary equations are no longer
parallel to the horizontal and vertical axes when cov(1,2)![]() This
gives the first serious implication for correlated uniforms. Since
This
gives the first serious implication for correlated uniforms. Since
![]() ,
the density is always larger for the uncorrelated case than for
the correlated, thereby giving a larger probability of failure
for areas of equal size. This implies an error in modeling may
underestimate risk.
,
the density is always larger for the uncorrelated case than for
the correlated, thereby giving a larger probability of failure
for areas of equal size. This implies an error in modeling may
underestimate risk.
The second serious implication for correlated uniforms
concerns the marginal distributions of the
![]() .
As will be shown, the marginal distributions are no longer uniform
but have a ramp-plateau-ramp profile. This fact will become
obvious when we explicitly define the boundary inequalities for the
joint distribution. Before we do so, we establish a convention
for deriving the inequalities. The
.
As will be shown, the marginal distributions are no longer uniform
but have a ramp-plateau-ramp profile. This fact will become
obvious when we explicitly define the boundary inequalities for the
joint distribution. Before we do so, we establish a convention
for deriving the inequalities. The
![]() transformation
matrix will be constructed by placing the eigenvalue with the larger
absolute value in the (1,1) position of
transformation
matrix will be constructed by placing the eigenvalue with the larger
absolute value in the (1,1) position of
![]() and
its corresponding eigenvector in the first column of the
and
its corresponding eigenvector in the first column of the
![]() matrix.
matrix.
![]() will
be considered as the horizontal axis.
will
be considered as the horizontal axis.
With these conventions, the boundary inequalities for the correlated joint uniform distribution are:
![]() Inequalities (1a& 1b)
Inequalities (1a& 1b)
![]() Inequalities (2a & 2b)
Inequalities (2a & 2b)
where
![]() =
= and
and
![]() =
= .
The
.
The
![]() are
normalizing factors. The inequalities come directly from the
orthogonal eigenvectors of
are
normalizing factors. The inequalities come directly from the
orthogonal eigenvectors of
![]() so
the coefficients of
so
the coefficients of
![]() and
and
![]() are
negative reciprocals.
are
negative reciprocals.
To find the bounds on the![]() for
for
![]() ,
one needs to express the
,
one needs to express the
![]() in
terms of
in
terms of
![]() .
Since
.
Since
![]() ,
for all j,
,
for all j,


Given the bound
![]() ,
if one lets the covariance increases from 0 to
,
if one lets the covariance increases from 0 to
![]() ,
the tangent angle of the vertical boundary of the domain of the
uncorrelated joint uniform increases from
,
the tangent angle of the vertical boundary of the domain of the
uncorrelated joint uniform increases from
![]() to
to
 .
With the convention of placing the eigenvalue with the largest
absolute value in position (1, 1), the maximum angle of deflection
from the vertical is
.
With the convention of placing the eigenvalue with the largest
absolute value in position (1, 1), the maximum angle of deflection
from the vertical is
![]() in
the positive direction. If
in
the positive direction. If
![]() ,
the angle of deflection is less than
,
the angle of deflection is less than
![]() .
For negative covariance, the directions are reversed. At the limiting
value of the covariance, the distribution degenerates into a straight
line with slope
.
For negative covariance, the directions are reversed. At the limiting
value of the covariance, the distribution degenerates into a straight
line with slope
![]() .
At the linit value the eigenvalues of
.
At the linit value the eigenvalues of
![]() are
are
![]() ,
so the Jacobian of the inverse transformation is undefined due to
division by zero.
,
so the Jacobian of the inverse transformation is undefined due to
division by zero.
The cause of the change from constant marginal density functions to those whose profile is ramp-plateau-ramp is made clear by a simulation example. The covariance matrix was arbitrarily chosen as

For a choice of
![]() ,
1000 sample variates and a scatterplot of the sample
distribution were generated.
,
1000 sample variates and a scatterplot of the sample
distribution were generated.
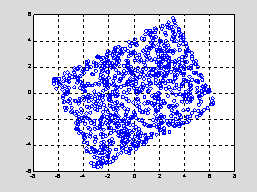
Fig. 1 Scatterplot, cov(1,2) = 2
The theoretical boundary inequalities and maximum values are:
![]()
![]()
![]()
![]()
The cause of ramp-plateau-ramp profiles of the marginal distributions is evident if one draws vertical lines through the lower left vertex and upper right vertex. Between the 2 vertical lines we have a rhombus and outside the lines we have right triangles with equal areas.
The marginal densities for
![]() are
given below:
are
given below:
![]() domain
domain
![]()
![]()
![]()
![]()
![]()
![]()
![]() domain
domain
![]()
![]()
![]()
![]()
![]()
![]()
Over the joint domain the ratio of the correlated pdf
divided by the uncorrelated pdf is 1.039 when
![]() .
But the ratio of the constant region of the marginal of
.
But the ratio of the constant region of the marginal of
![]() divided
by the uncorrelated pdf increases to 1.061; for
divided
by the uncorrelated pdf increases to 1.061; for
![]() ,
the ratio is 1.225. The risk of failure is higher in the constant
region correlation for non-zero correlation emphasizing the care
needed in modeling.
,
the ratio is 1.225. The risk of failure is higher in the constant
region correlation for non-zero correlation emphasizing the care
needed in modeling.
The scatterplot of two additional simulations are
included. In both simulations the variances where kept at 9 and 6,
respectively, but the covariance was increased. .Figure 2 is the
scatterplot for
![]() The
purpose of the example is to show: (a) how the width of the rhombus
decreases as the covariance increases, and (b) how the angle of
deflection increases. The scatterplot in Figure 3 is the limit case
in which
The
purpose of the example is to show: (a) how the width of the rhombus
decreases as the covariance increases, and (b) how the angle of
deflection increases. The scatterplot in Figure 3 is the limit case
in which
![]() .
.
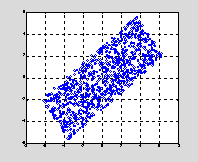
Fig. 2 Scatterplot, cov(1,2) = 5.5
For![]() ,
the original vertical angle boundary has been displaced by an angle
of
,
the original vertical angle boundary has been displaced by an angle
of
![]() or
about 37.4 degrees. The decrease in the width of the rhombus
decreases the domain of the linear functions
or
about 37.4 degrees. The decrease in the width of the rhombus
decreases the domain of the linear functions![]() or
the ramp sections of the density function.
or
the ramp sections of the density function.
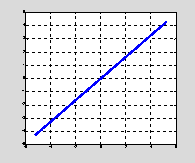
Fig. 3 Scatterplot, cov(1,2) =
![]()
The correlated joint Uniform distribution becomes
degenerate at the limit value of the covariance. The tangent
angle is
![]() or
39.23 degrees.
or
39.23 degrees.